Functions
A function is used to describe a relationship between things. If one thing changes, then something else also changes.
If you take an ice cream out of the freezer and leave it, it will slowly melt as time goes by, because it gets warmer.
There is therefore a relationship between the passing of time and the rising temperature.
It could also be the price of ice cream. If you buy one ice cream, it costs 5 euro. If you buy two ice creams, they cost 10 euro, and so on.
A function that can calculate the price of ice cream looks like this:
$$ \large y=5x $$
Where \(\large x\) is the number of ice creams, and \(\large y \) is the price.
The function is a 1st degree polynomial (linear function).
It is also a proportional function, because it will always pass through the origin (the point \( (0,0) \)).
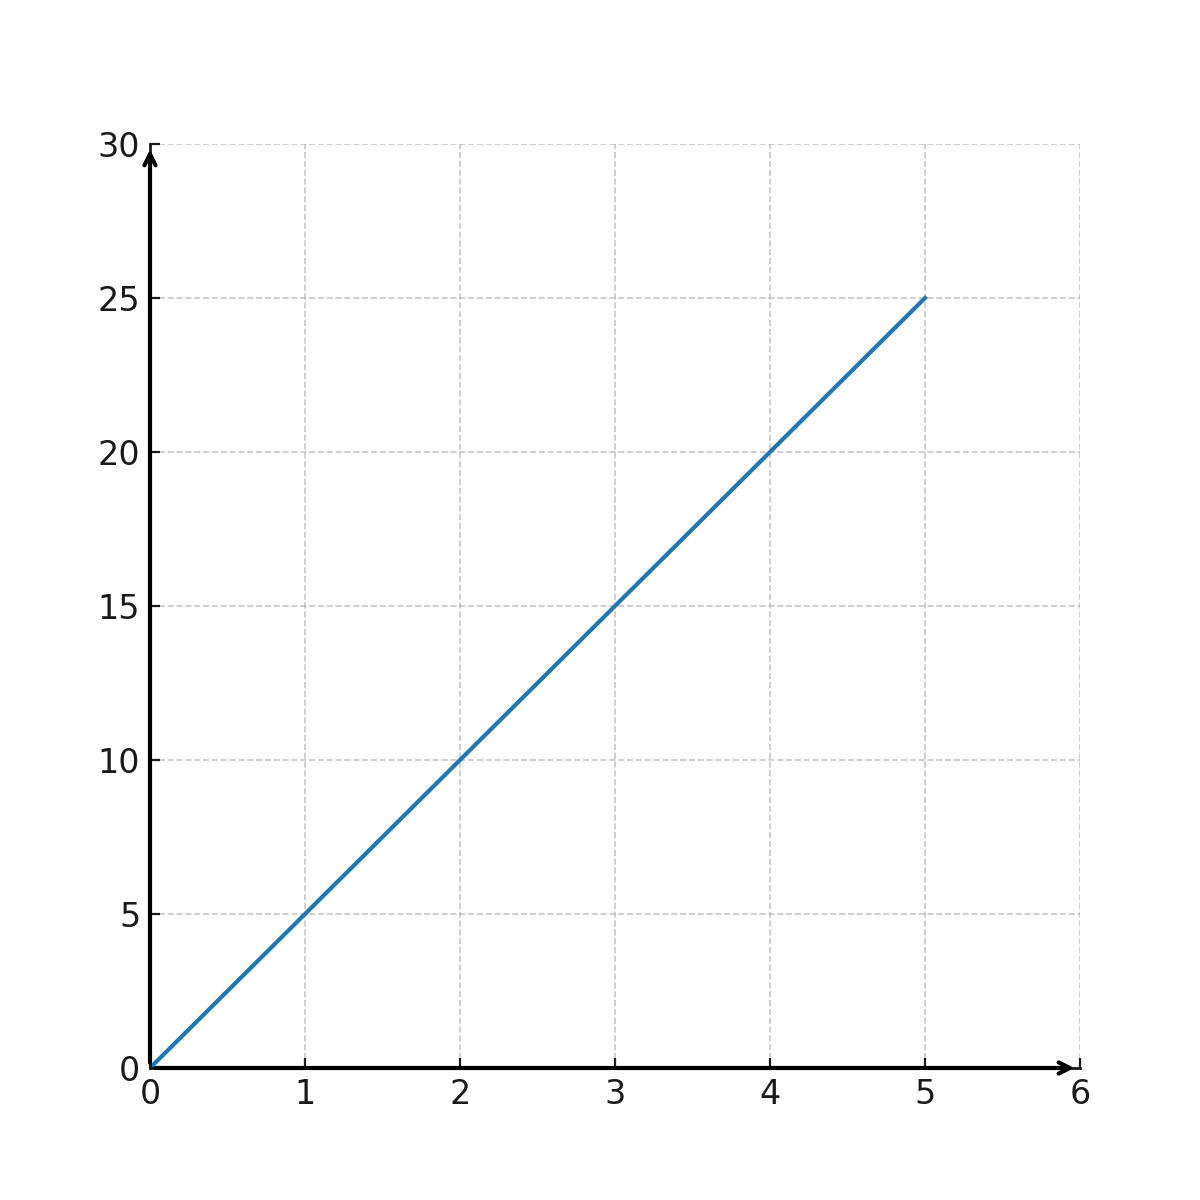
The graph shows the development of the price of ice cream
Number of ice creams on the X axis and the price on the Y axis
Drawing a graph
When drawing the function as a graph in a coordinate system, \(\large x\) is called the independent variable (number of ice creams), and \(\large y\) the dependent variable (the price).
Each time you insert a value for \(\large x\) into your function, you can calculate the corresponding value for \(\large y\) and thus plot a point in the coordinate system.
Example:
-
If you insert \(\large x=1 \) ice cream into the function, you get \(\large y=5 \).
-
If you insert \(\large x=5 \) ice creams into the function, you get \(\large y=25\).
Now we have two coordinate sets \(\large (1,5)\) and \(\large (5,25)\). When plotted in the coordinate system and connected by a straight line through the origin, we get the graph above.